
SERVING YOUR IDEA
We provide a full suite of spatial services from data acquisition and processing, to cartography and web mapping, to decision making support and continuing education.
Geospatial Services
- Spatial Data Management & Analysis
- Cartography
- Web Mapping
- Digital Data Collection
- Satellite Image Processing / Remote Sensing
- Custom Application Development
OUR WORK
WarthogIS is currently working with the Puget Sound Partnership and Western Washington University to map active channels across the watersheds of Puget Sound. The ‘active channel’ is approximately the bankfull channel, or the ordinary high-water mark line, which includes the wetted channels of rivers and streams as well as adjacent unvegetated cobble and gravel bars that are inundated during high flows.
For this project, active channels are delineated from LiDAR Digital Terrain Models (DTMs). The objective of this project is to provide accurate stream bank identification to support the mapping of riparian management zones throughout the Puget Sound watersheds.
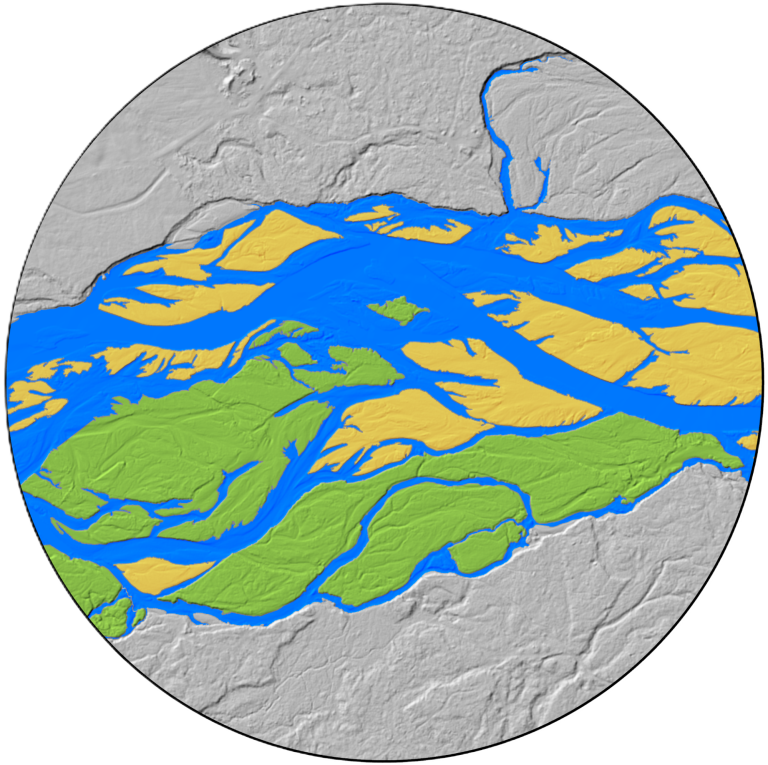
Active Channel Mapping for the Puget Sound
Puget Sound Partnership | February, 2024 - Current
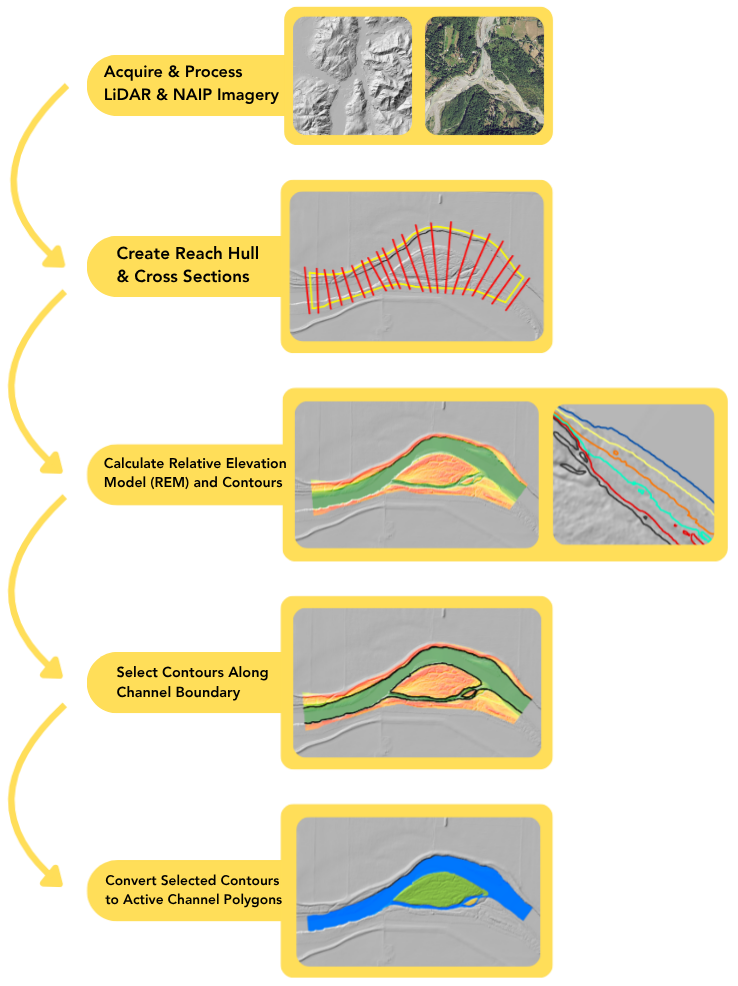
WarthogIS collaborated with project partners to develop a step-by-step methods document covering the complete active channel delineation process, a project geodatabase with metadata and an attribute schema for active channel polyline and polygon mapping, and a Python-based ArcGIS Pro toolbox.
The toolbox can be used to delineate active channels along river mainstems and larger tributaries by generating a relative elevation model (REM) and contours at specified elevations to approximate various water surface elevations and help identify the active channel boundary.
To download Active Channel data or learn more about this project, Click Here
With some of the most carbon dense forests in the world, British Columbia has long been a prime target for logging. These forests, which contain vast swaths of old growth and vital caribou habitat, are at risk of irreversible biodiversity loss. The areas most at risk are those that are within reach of pellet mills — facilities that convert lumber into wood pellets. These areas, known as “haul zones,” overlap with critical old growth habitat.
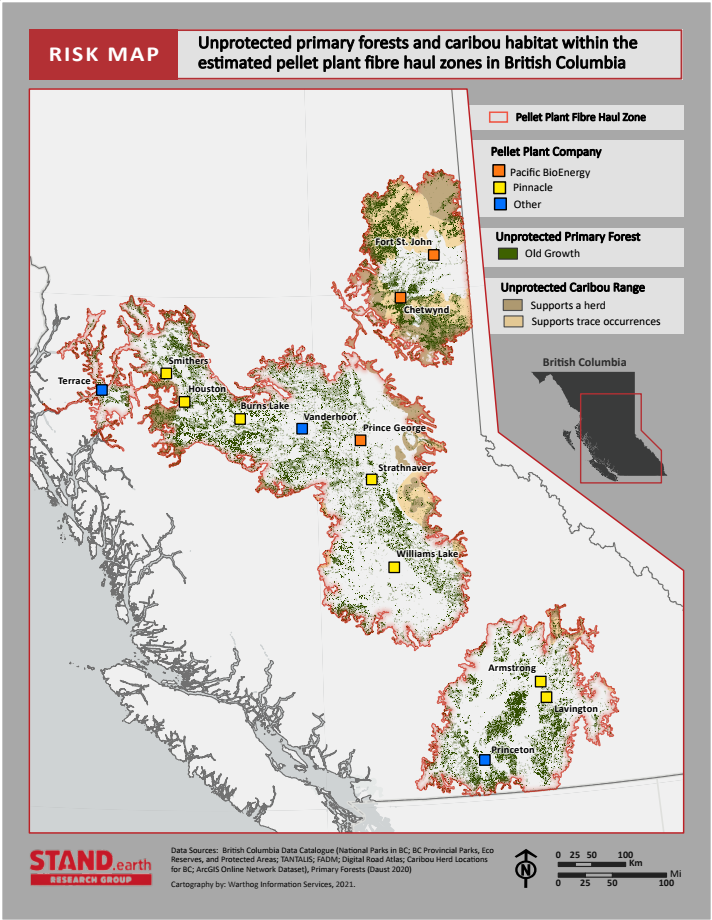
Risk Map: Pellet Facilities Threaten Primary Forest and Caribou Habitat
STAND.earth Research Group | September/November, 2021
In an effort to identify the extent of old growth and caribou habitat at risk, WarthogIS, in collaboration with STAND.earth Research Group, conducted risk-based analyses by modeling network service areas of wood pellet mill haul zones across British Columbia. WarthogIS found the area of overlap between known old growth and caribou habitat and wood pellet mill haul zones to be nearly 845,000 hectares.
The results of this analysis were released at the 2021 United Nations Climate Change Conference (COP26) in Glasgow, Scotland.
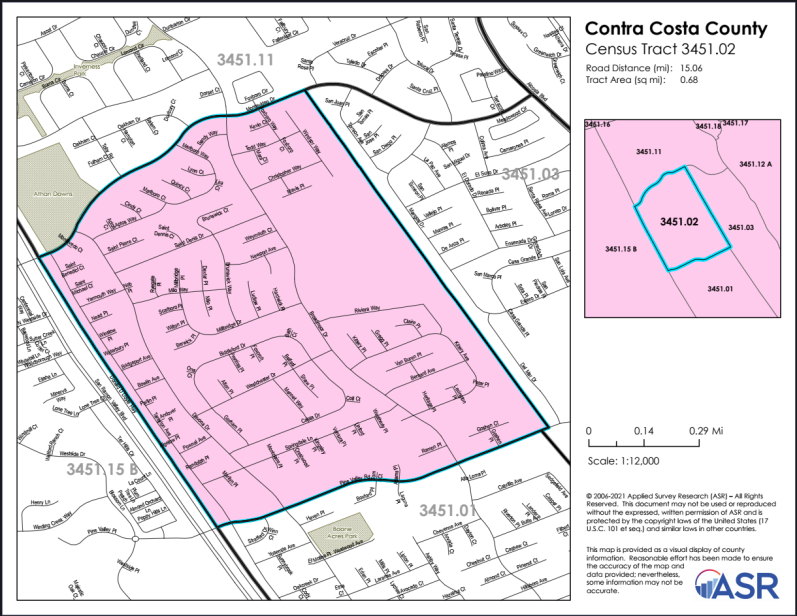
In collaboration with Applied Survey Research (ASR), WarthogIS assisted in implementing the 2023 Point-in-Time (PIT) Count across several counties in northern California. PIT counts approximate the number of people experiencing homelessness in each community and assist the federal government in better understanding the extent and nature of homelessness nationwide. The PIT count is conducted by survey researchers on a census tract by census tract basis and requires a visual enumeration of unsheltered persons and families experiencing homelessness, including those sleeping outdoors, on the street, or in parks, tents, or vehicles.
2023 Point-in-Time (PIT) Count
Applied Survey Research (ASR) | November/December, 2022
In order to accurately conduct the PIT count, survey researchers were assigned a census tract and provided with a detailed map delineating the assigned census tract as well as adjacent census tracts, roads (with labels), and parks. In order to produce the 208 maps required for the PIT count, WarthogIS utilized complex geovisualization techniques to automate the production of maps without losing detail or vital geographic information. Once the maps were produced, a comprehensive review of all maps, one-by-one, was conducted to ensure that each map was legible and detailed enough to successfully guide the survey researchers in the field.
To account for maps containing census tracts of varying size and street densities, detailed work with scale and map extent was required. For example, large census tracts containing a large portion of uninhabited space while also containing small areas of communities with a high density of streets required WarthogIS to split census tracts by hand and manually adjust the scale and extent of the maps until the required level of detail was achieved.
By providing ASR with the necessary materials to carry out and report findings for the 2023 PIT count, WarthogIS played an important role in assisting service providers, policy makers, funders, and local, state, and federal governments in not only gaining a better understanding of the persons experiencing homelessness, but also measuring the impact of current policies and programming, and future planning efforts.
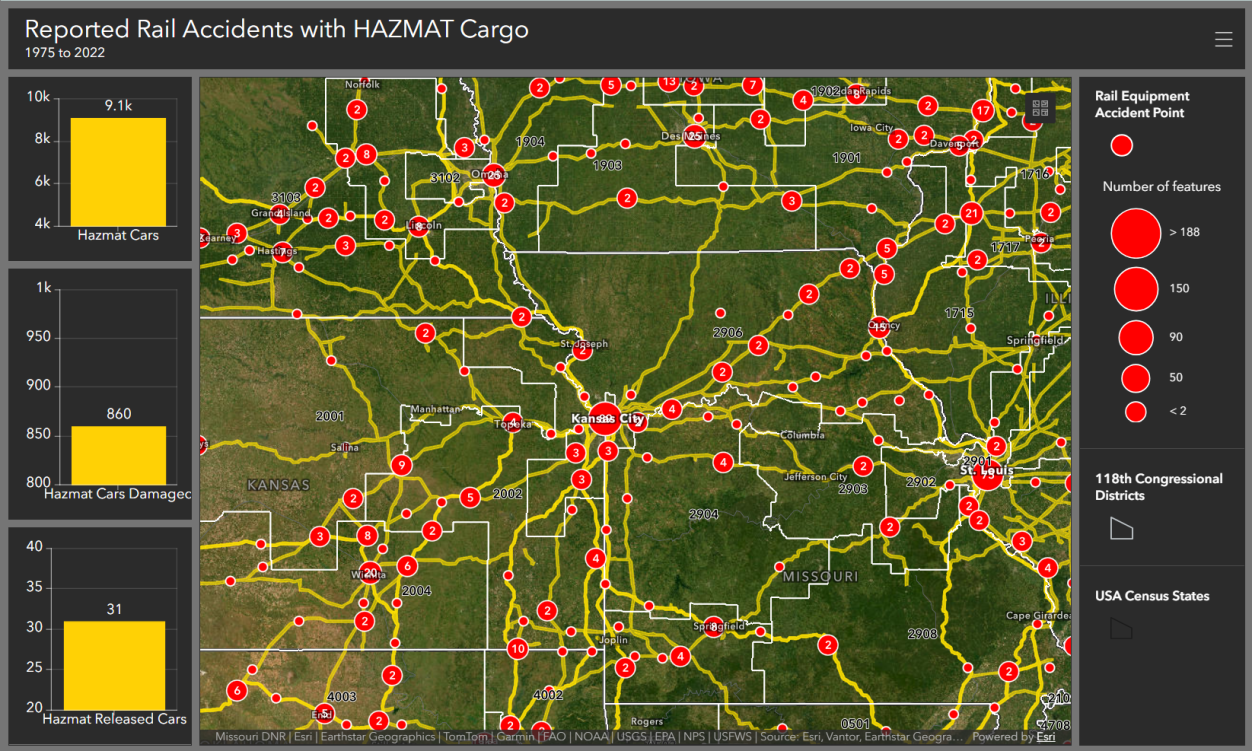
With the growing concern among train derailments across the U.S., there has been a greater need for information regarding the extent and spatial distribution of rail lines carrying hazardous materials. In an effort to shed light on this issue, WarthogIS was tasked with developing a nationwide dataset of rail lines carrying hazardous cargo, including locations of reported rail accidents.
In order to produce an accurate, high resolution dataset at a continental scale, WarthogIS meticulously executed the process of manually selecting rail lines that met specific criteria based on historical rail accident data as well as rail classifications across the country. From this dataset, 1-mile buffers around every rail line carrying HAZMAT cargo were produced to both delineate evacuation zones and illuminate areas of greatest concern, such as those where rail lines carrying hazardous cargo ran through dense population, near water, and/or next to utilities.
To convey this information in a meaningful and informative way, WarthogIS produced an interactive dashboard displaying the 1-mile evacuation zones, rail accident points, urban areas, and schools. This dashboard not only allowed users to click on features to learn more information, but as the user panned and/or zoomed around the map, the number of reported rail accidents (including the type) automatically updated to display information within the current map extent.
In this way, WarthogIS achieved project goals by 1) creating a high quality dataset guided by a careful, comprehensive review of existing data and relevant attributes, and 2) producing an informative dashboard application for geospatial data that maintained a high level of detail and information at both large and small scales.
HAZMAT Rail Accident Dashboard
Bloomberg Philanthropies - Beyond Petrochemicals | April, 2023